


The M2 Global Money Supply Narrative is Wrong. Here is Why!
$TRUMP owners are in for a treat while Wall Street is buying again. Sentiment is better as Crypto Spring comes.

Hi,🙋
Welcome to the weekly CryptoFolks Newsletter—a press review 📰of the crypto world and the current macroeconomic situation, where we explore what lies beyond the right side of the chart. However, our launch procedures 🛫 require us to inform you not to consider this article as investment advice, as it represents solely our personal opinion. Always remember to manage your portfolios independently.💁♂️
Meme of the Week

The Past Week,
After the holiday break, it turned out to be the best in a long time! 📈 It seems that investors, speculators, retail traders, and market tourists had a lot of time for reflection during the holidays.
The result of such intense thinking about their investment strategies, combined with several important events from the White House 🇺🇸 and a comparison of Bitcoin’s price chart with other charts — including the global M2 money supply — led to a “grand return” of prices back to “normal.”
We also saw capital flowing back into exchanges, something we needed like air for the recorded gains — but is it enough to continue? Is the current trend just a bull trap, or maybe the beginning of the final parabolic move? 🚀 What scenarios are ahead for Bitcoin? Is the train leaving the station right now? 🚂 You’ll find answers to these and many other questions in this newsletter. So sit back, relax, and enjoy the read!

Cryptocurrency Market Capitalization
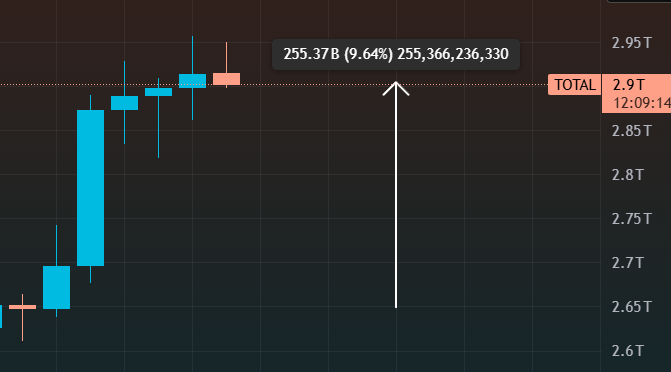
As you can see in the screenshot above, the past week broke the losing streak and the series of new lows, delivering an almost 10% increase in the total crypto market capitalization, reaching $2.9 trillion. This means that we are already “close” to breaking the magical $3 trillion barrier once again — sounds better than having a “2” at the front, right? 😎
Moreover, looking at the chart through the lens of technical analysis and the cyclicality of the crypto market, you could conclude that we are on track to set new highs above the $4 trillion level. Now you may ask, where’s the analysis? 📊 I’ve detailed it in the paid part of this newsletter, using Bitcoin as an example, since it constitutes the lion’s share of the entire crypto market — something you probably already know from previous newsletters.
So, if you want to prepare properly for the grand finale of this bull run and you enjoy my content — hit the subscribe button and stay one step ahead of the crowd!
Altcoins

Altcoins outside the top 10 are also in good shape! 🚀 Just like the entire crypto market, their chart looks like a “stairway to heaven.” Over the past week, altcoin capitalization has grown by nearly 14%, reaching $239.6 billion, which now makes up 12% of the total crypto market. This shows that although altcoins can deliver high returns, hitting that one lucky project that brings cosmic profits is like winning the lottery - so it’s wiser to stick to stable, well-proven projects with strong fundamentals.
Now let’s move on to the specific projects.
Bitcoin

Bitcoin has grown over 10% in the past 7 days, decisively breaking above $90K, and currently trading at over $94K. Furthermore, the price is now at a key level for major price movements, which could soon attract market tourists again. 🌊
Ethereum

Ethereum also had a lucky week, as it seems to be lagging less than before - finally escaping from the $1500 zone! Now it's priced at $1800. 😅 Jokes aside, it’s nice to see ETH getting closer to the $2000 barrier, right? Looking at the technicals - over the past week, Ethereum has grown by over 13%, stabilizing around $1800, providing a solid base for further growth.
Remember our yellow resistance line from over 4 months ago? The one Ether kept failing to break through? Well, it looks like ETH is approaching that line again, and this time it might actually break through it, as you can see in the screenshot below.

Will ETH finally achieve mythical gains? We’ll know within a few days, but personally, I’m leaning towards a breakout and stabilization above this resistance level.
XRP

Last week also ended green for XRP, but compared to other projects, it looks rather weak, posting a 4.6% increase to $2.17. It’s not bad, considering XRP remains above $2, but its holders surely hoped for more, especially since ETH gained more than XRP during the week. 😅
Solana
Even Solana outperformed XRP over the past 7 days, posting a 7.2% increase with the current price at $147. That’s a 54% jump from the bottom at $95, so kudos to those who added Solana to their shopping list during the promotion. 🛒
We’re not slowing down — next up: traditional market valuations!
S&P 500

No wonder everything in crypto is pumping 🚀, considering that the main pump is coming from the index of the 500 largest companies in the USA, namely the SPX, which since last week (Holy Thursday), has grown by over 4.5%, breaking the 5.5k USD level. To be more precise, its price stands at 5,525.22 USD.
We can see that Donald Trump's policies, which I will mention again later, are benefiting not just various countries around the world, but also indexes like the SPX, which is slowly returning to normal.
Nasdaq 100

Tech companies are doing even better 🌟, having gained almost 6.5%, with the index currently valued at 19,432.56 USD, which represents a bounce of over 17% from the bottom. The conclusion? NDX, just like SPX, is returning to normal, rewarding investors who decided to buy at the dip.
Russell 2000

When it comes to percentage growth over the past week, the small and medium-sized companies index behaved similarly to SPX, gaining 4.75%, with its current value at 1,954.9 USD.
Dow Jones

Dow Jones definitely performed the weakest among all the indexes presented above, as its gain for the past week amounted to exactly 2.5%. Still, it's not a bad result 📈, considering we’re talking about the oldest index on the American stock exchange, where you won't see as much volatility as in the crypto market. Its current value is 40,113.50 USD.
What’s the crypto press saying? 🗞️
End of Tariffs on China?
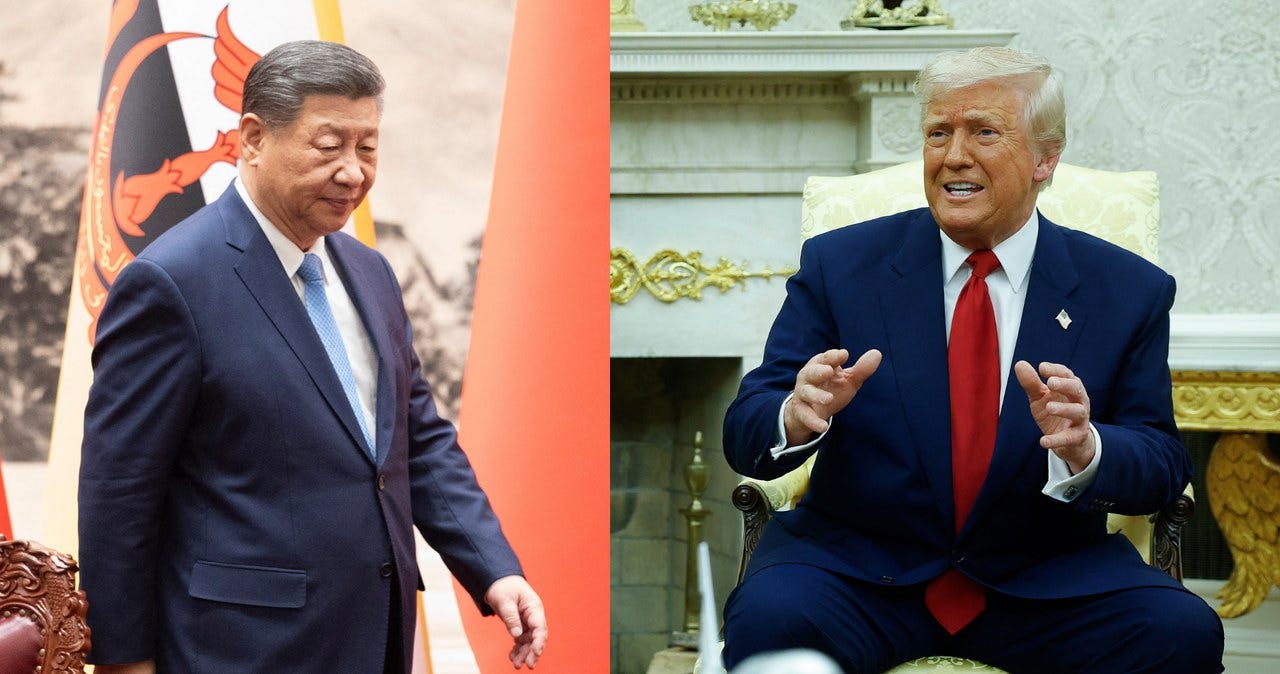
Donald Trump announced some time ago that he is ready to negotiate with China's President, Xi Jinping, regarding the tariffs imposed by the United States on imported goods from the Asian country. This news stirred traditional markets, resulting in sudden increases 📈, as you saw earlier, which also translated into a 10% Bitcoin surge and similar gains for altcoins.
However, will both leaders manage to negotiate terms that satisfy both sides? We shall see, but one thing is certain — these talks, combined with an upcoming major macroeconomic event in the USA, will be crucial for shaping the final stages of this bull run.
End of TON Transfers from ETH

TON announced that on May 10, 2025, it will shut down the Toncoin Bridge — the tool used to transfer Toncoin (TON) between the TON network and Ethereum and BNB Smart Chain blockchains. This decision is due to the development of more advanced and secure cross-chain solutions like LayerZero, Stargate, and Symbiosis, as well as the growing independence of the TON ecosystem.
Users can continue using the bridge until then, and after its shutdown, they can still withdraw previously sent funds. TON also announced new initiatives, including the "Synergy" fund worth 5 million dollars to support cross-chain projects and to develop the Layer 2 payment network and integrations with other blockchains.
More Freedom, Fewer Regulations for Crypto
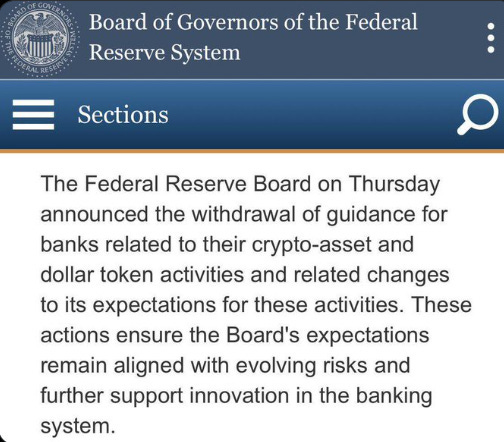
On Thursday, the Federal Reserve Board announced it is withdrawing all previous guidelines for commercial banks regarding crypto-related services. Banks no longer have to follow old rules or report every crypto-related activity 🏦.
The Fed’s new approach aims to better reflect the changing reality and to support innovation in the banking system. This is a huge signal that cryptocurrencies are becoming a permanent part of traditional finance. We’ll learn more details later in May — and it looks like it's going to be something the crypto community will absolutely love! 😍
Will President Pass Some Ham Please?

Recently, we’ve seen a sudden surge in the value of President Donald Trump’s memecoin — TRUMP 🐷. This happened following Trump's announcement about the possibility of having dinner with a group of the biggest holders of his token. I
nitially, it was unclear how many people would qualify, and Trump's hardcore fans could only guess. However, it all became clear a few days ago, when Donald Trump officially stated that the honor will be reserved for the TOP220 holders of the TRUMP memecoin.
By the way, it would be interesting if someone from the crypto universe we know got a seat at that table! 🍽️ Maybe you’re planning to have dinner with the President and are collecting tokens yourself? Let me know in the comments!
What About Sentiment?

Just as quickly as sentiment can drop to extreme lows, it can bounce back to high levels - as you can see in the attached image. It just shows that crypto investor sentiment can flip 180 degrees in a very short time ⏳, and all it takes is one news story about potential tariff rollbacks with China, resulting in Bitcoin jumping by 10%.
Current sentiment levels are around 60 - leading us back into greed territory.
Earlier this week, it even reached 72, which is close to extreme greed.
Funny thing is 😅, just a few weeks ago, we were seeing extreme pessimism and outright panic around levels of 3!
Anyway, things are looking good for now - sentiment is healthy, so we can expect another wave of "tourists" and street-level investors hitting the market soon, which should further boost sentiment and drive crypto prices higher. 📈
What is smart money currently doing?
They're entering the market again.
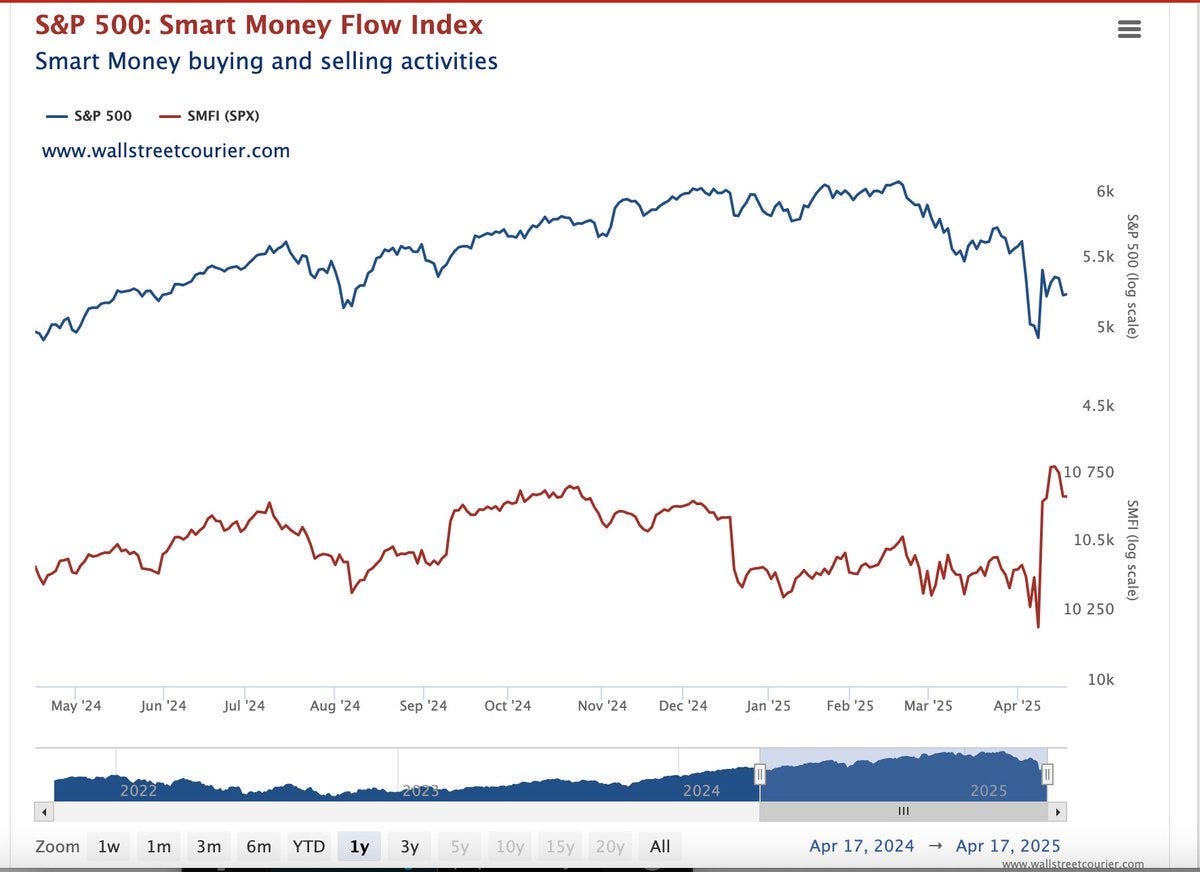
Of course, this refers to the stock market, more specifically the S&P 500, but that's where the wave of capital begins, later flowing into riskier assets like cryptocurrencies 🚀. The activity of whales - whose wallets we can categorize as smart money - is also increasing, as I mentioned in previous newsletters.
The FOMC meeting is approaching
The topic of interest rates is always relevant - unless they are zero and the printers are overheating 😅.
To the point: the next FOMC meeting is coming, and predictions are clear. On May 6th, the current interest rate levels are expected to be maintained. However, investors foresee four rate cuts later this year.

Cuts will unlock access to cheaper credit, bringing more capital into the market. Plus, there’s the looming crisis aspect, and central banks now have a special weapon for such cases — massive money printing.
The market expects rate cuts, believing that the highest rates are already behind us - and they’re probably right. Companies could face serious difficulties repaying interest and taking on new debt if rates stay high or rise further out of inflation fears triggered by tariffs.
The Fed is truly in a tough spot 🎯.
Bitcoin has made a sizable move in recent days,
And it's still ongoing — so who’s been buying?
The answer is: small wallets.
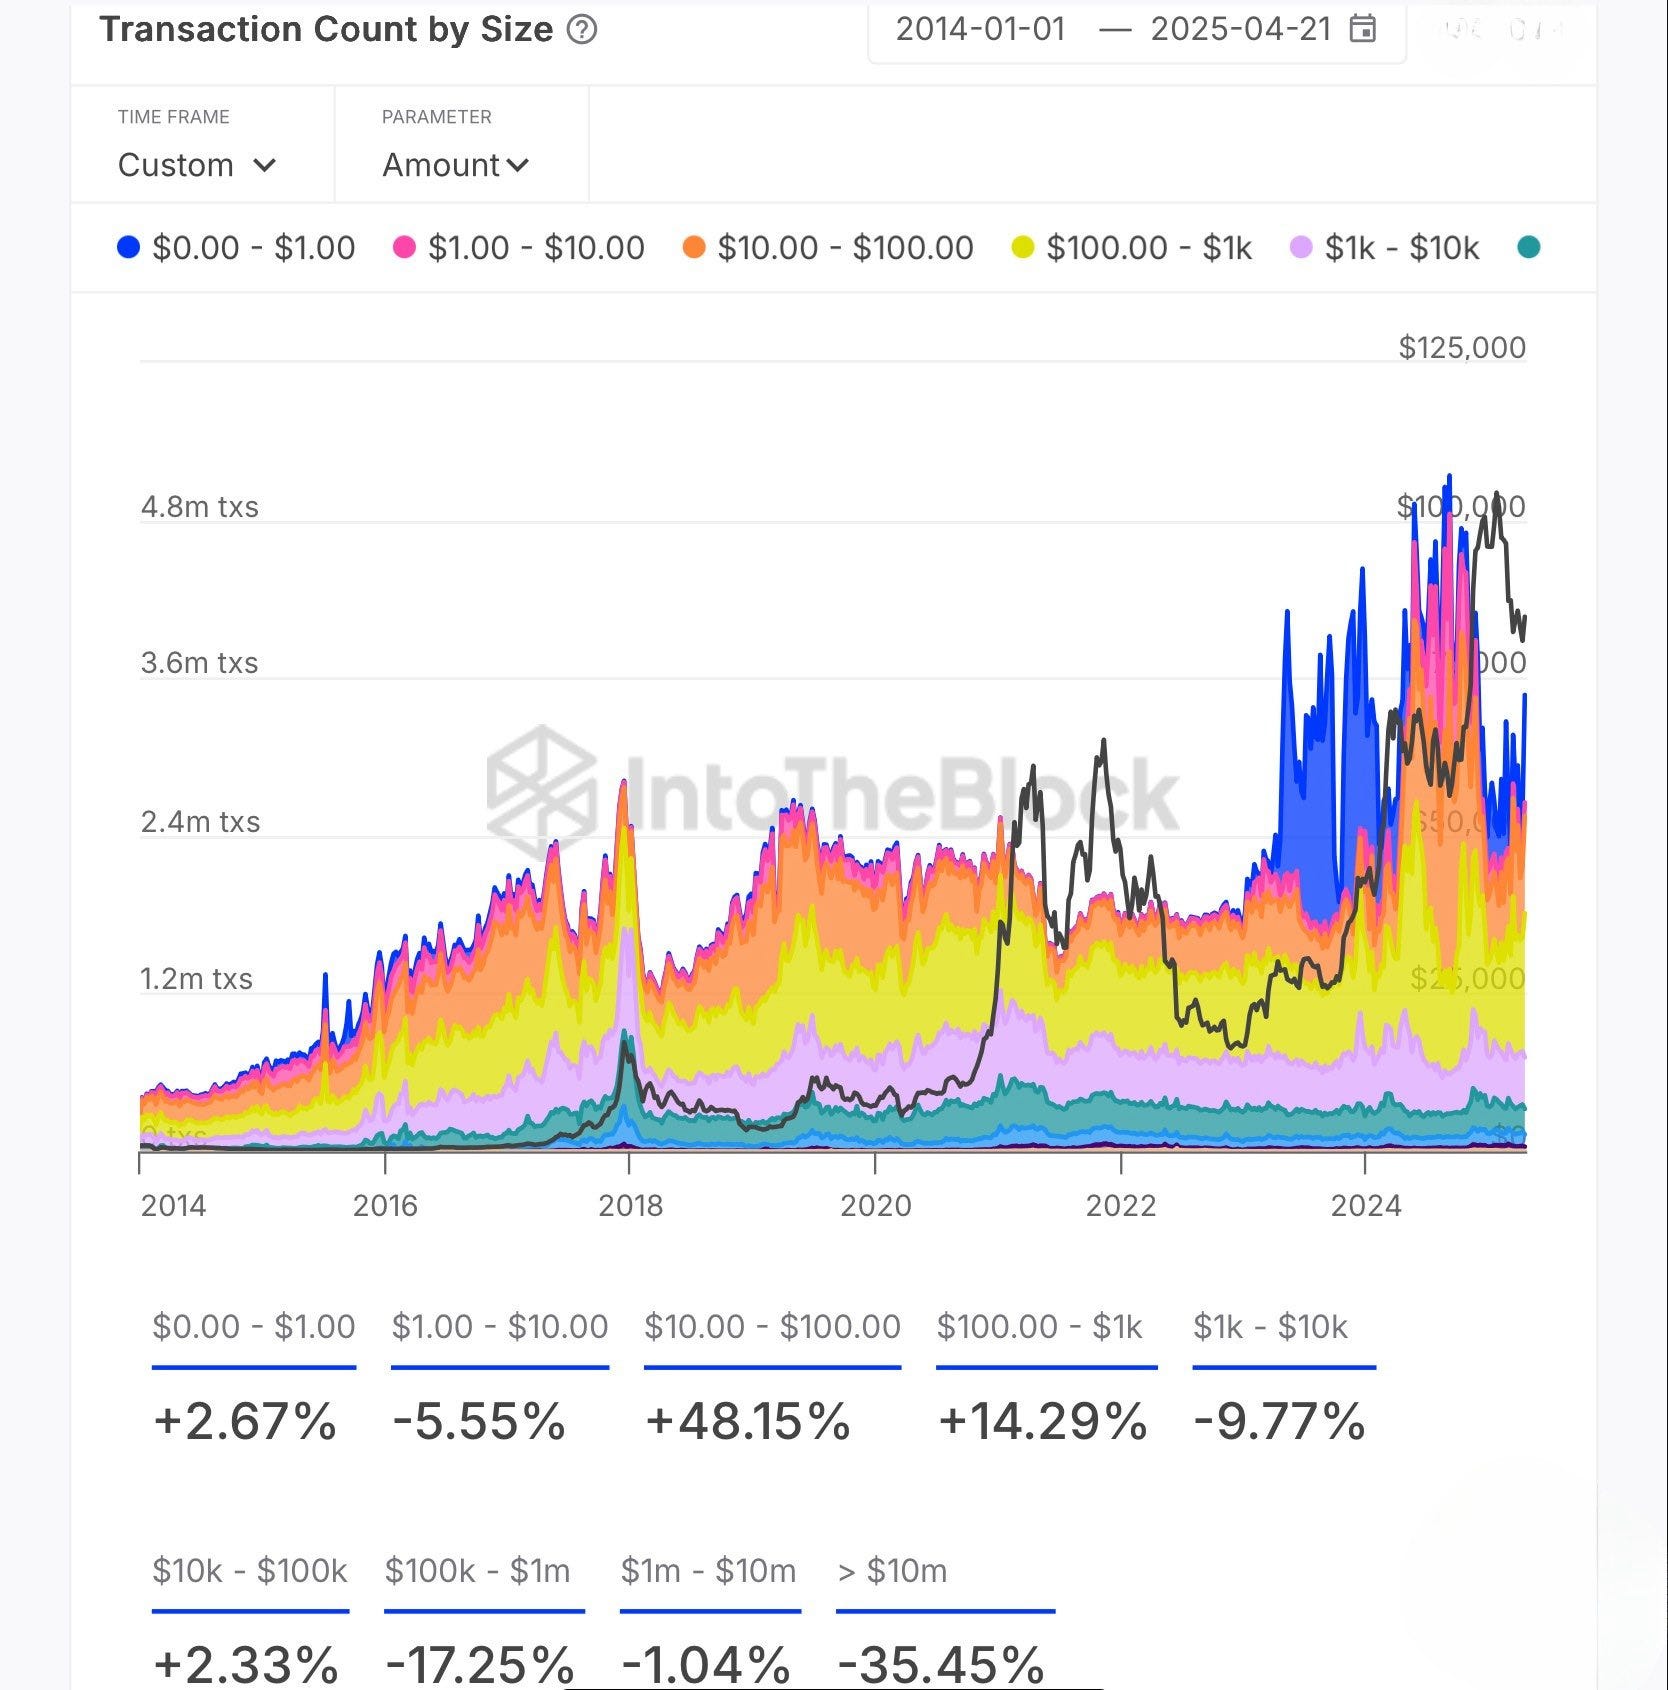
Here’s a breakdown:
• $0–$1: 817,470 tx (+155.78%)
• $10–$100: 740,809 tx (+37.55%)
• $100–$1k: 1,096,022 tx (+27.54%)
• $1–$10: 102,345 tx (−0.35%)
• $1k–$10k: 391,131 tx (−3.72%)
You might say that this isn’t reflected in the retail demand change indicator — and you’d be right! But that’s because the indicator measures the volume held in wallets over the last 30 days, not just the number of transactions.
Still, we're slowly ticking more days above the 0 level.

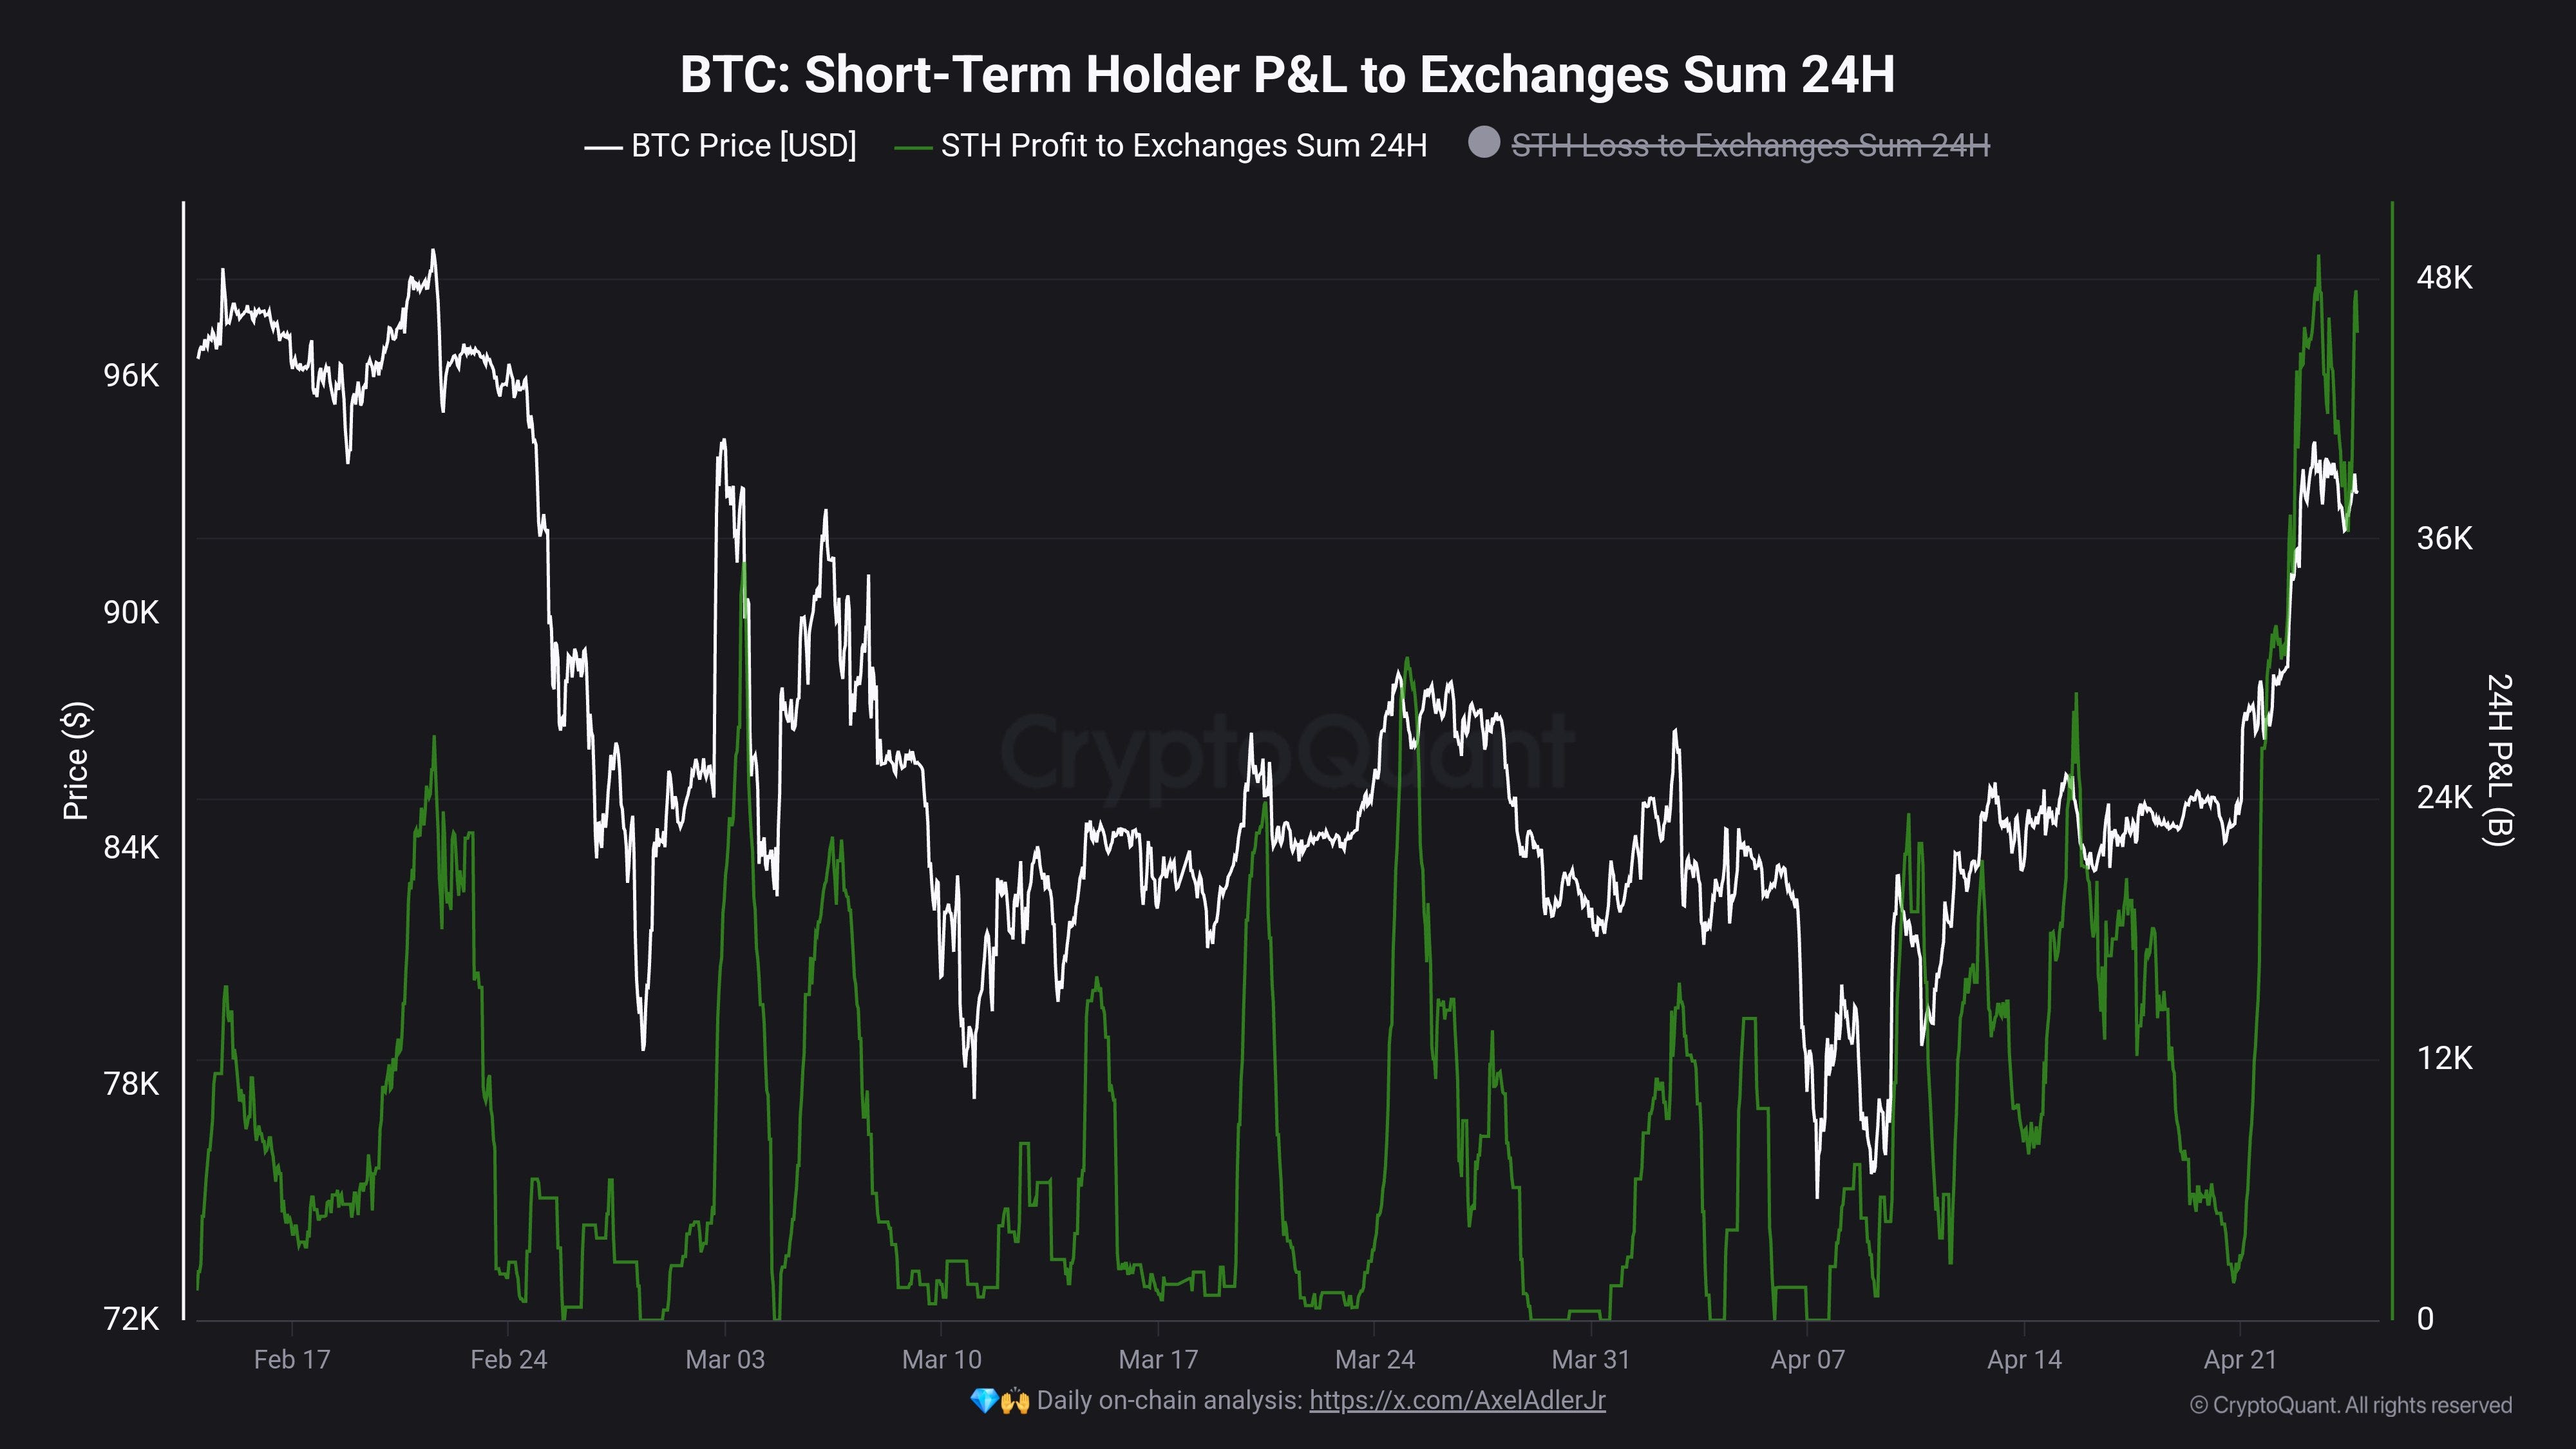
The recent gains gave short-term investors a chance to break even — and they took it.
The SOPR (Spent Output Profit Ratio) hit 1 📈, and at the same time, we saw one of the largest Bitcoin inflows to exchanges from this group of investors.
Moreover, the Apparent Demand indicator — capturing net changes in dormant supply (adjusted for daily mining rewards) — bounced strongly from extremely low levels (below -200,000 BTC).
This suggests that previously dormant capital is coming back into play ⚡
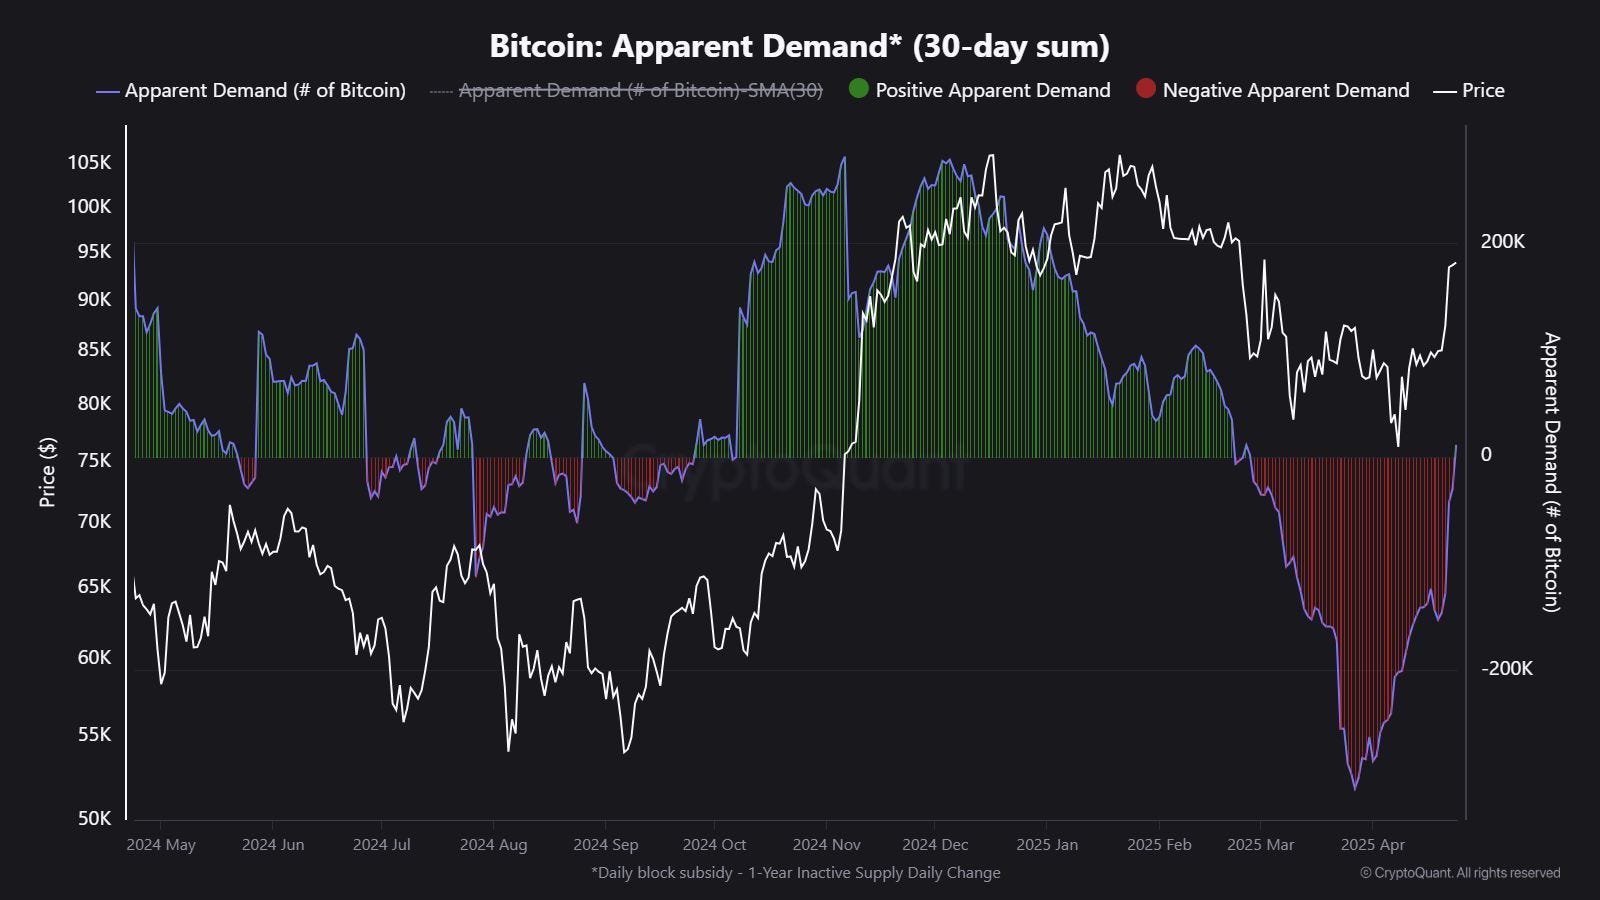
Such a move often signals trend reversals with strong momentum and trend continuation confirmation.
What else signals a trend reversal?
A negative funding rate, in this case, on Binance.
Funding rate is the periodic fee exchanged between long and short positions on perpetual futures contracts.
Unlike traditional futures, perpetuals don't expire, meaning they can stay open forever. The funding rate keeps futures prices in line with spot prices to prevent major long-term deviations.
When demand for longs is strong, futures prices rise above spot prices, leading to a positive funding rate — longs pay shorts.
When short demand is stronger, futures fall below spot, resulting in a negative funding rate — shorts pay longs.

Historically, such a setup often preceded major breakouts to the upside 📊 and medium-term trend reversals.
M2 Global Money Supply
With prices rising more and more people are jumping onto the M2 global money supply narrative 📚.

Let’s revisit my stance on this: 👇
It’s not that simple.
Most M2 values are updated monthly, and currently, most readings are from February.Also, global M2 means 46% of it comes from China, which changed its M2 calculation method recently, artificially boosting its figures (by widening the definition of what counts as money).
On top of that, M2 is measured in USD, meaning dollar valuation impacts it — and recently, the dollar has been declining 📉.
Right now, only China's M2 is above its post-COVID peak. In the rest of the world — and especially in the USA — M2 is growing at its slowest annual rate since Bitcoin was created.
When you convert the global money supply into dollars and then overlay it on Bitcoin (also priced in dollars), the whole correlation you talk about is actually about the dollar, not about other currencies.
It’s not UK M2 in pounds from two months ago — it’s today’s dollar.
Still, it’s fascinating to watch this correlation unfold over time. 🔍
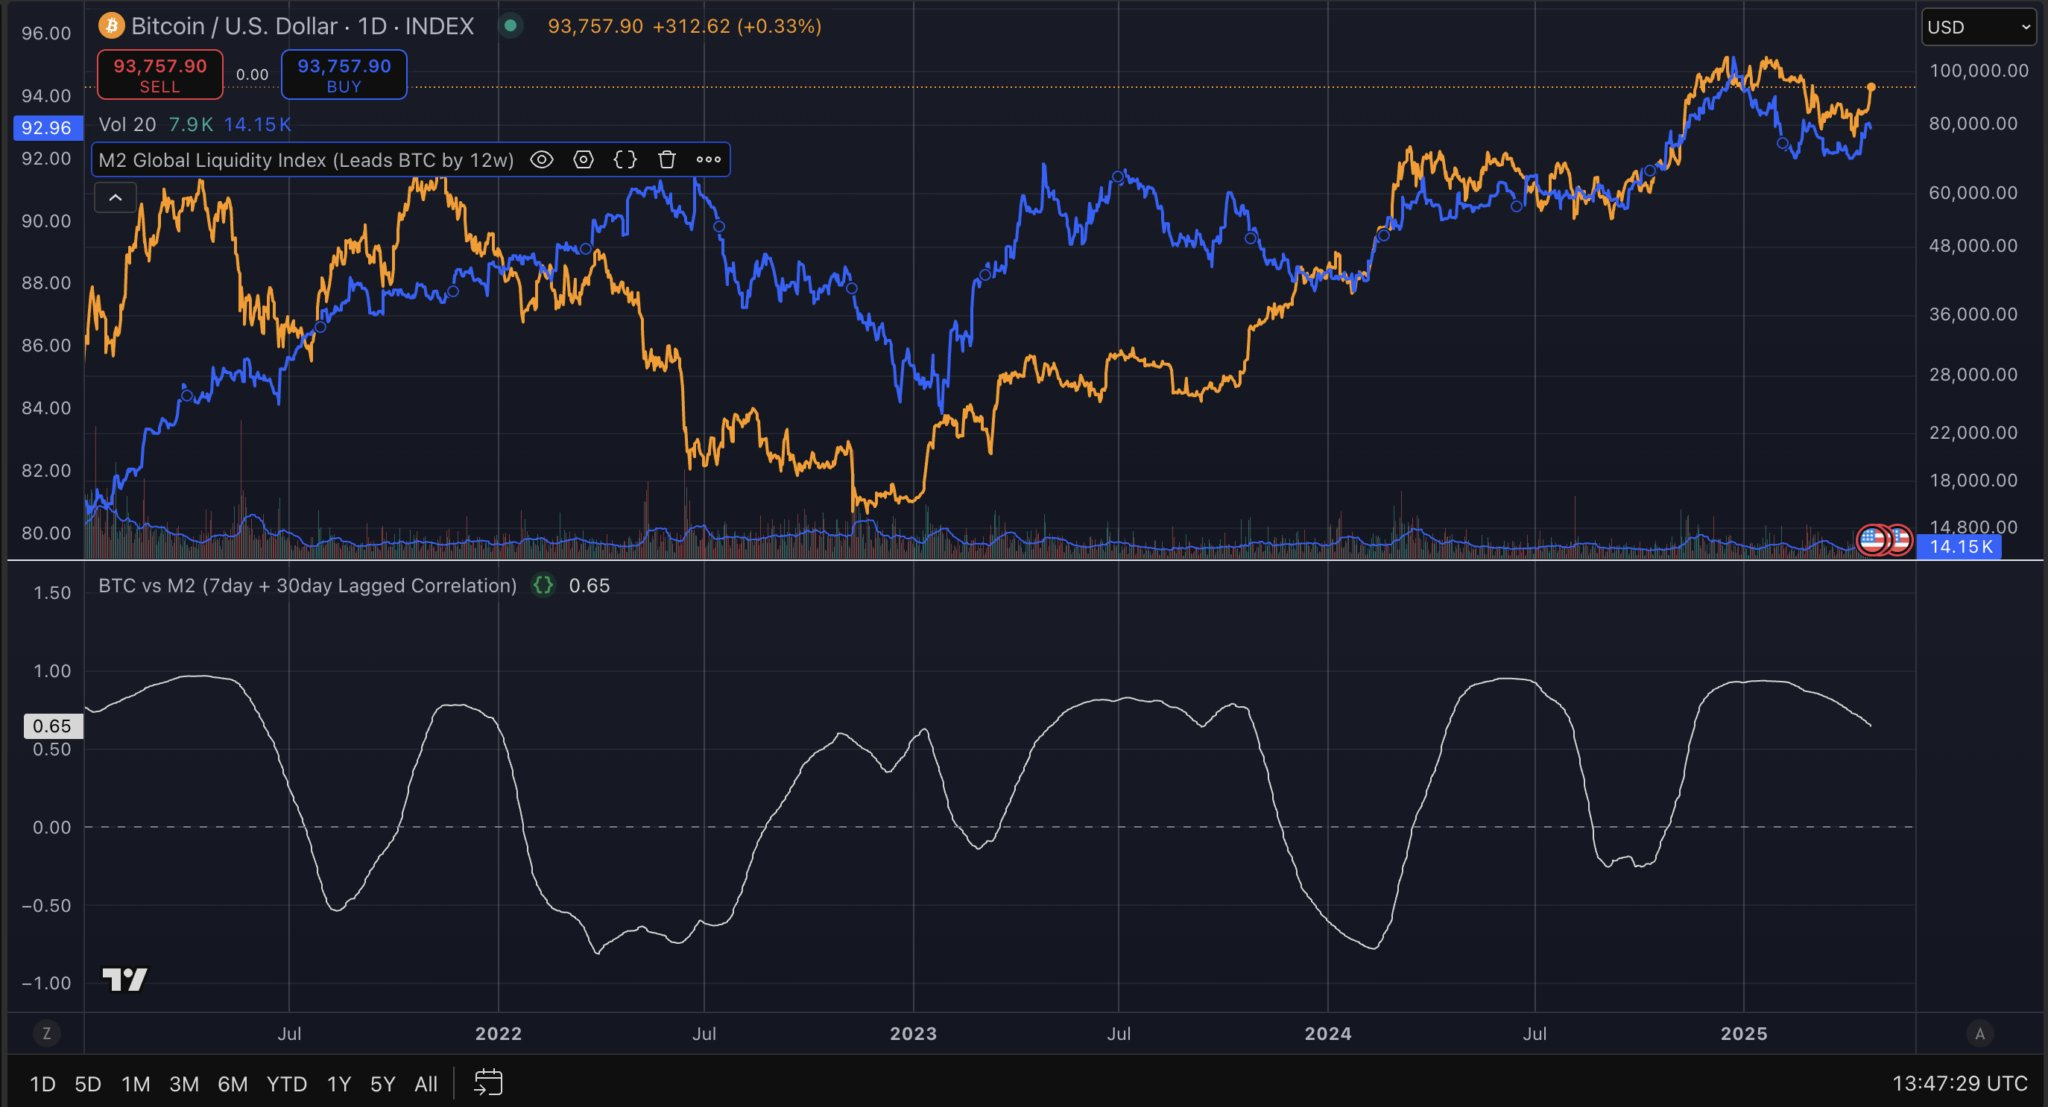
We also have historical data: since the 2021 bull run, the 180-day rolling Pearson correlation between Bitcoin and global M2 (lagged) oscillates between +0.95 and -0.90.
This points to cyclicality, not permanent correlation, since money supply expansions/contractions don't exactly match Bitcoin cycles.
courtesy of: https://x.com/CryptoNews_eth
Don’t get me wrong, I am still bullish, just this narrative is not really the way things work.
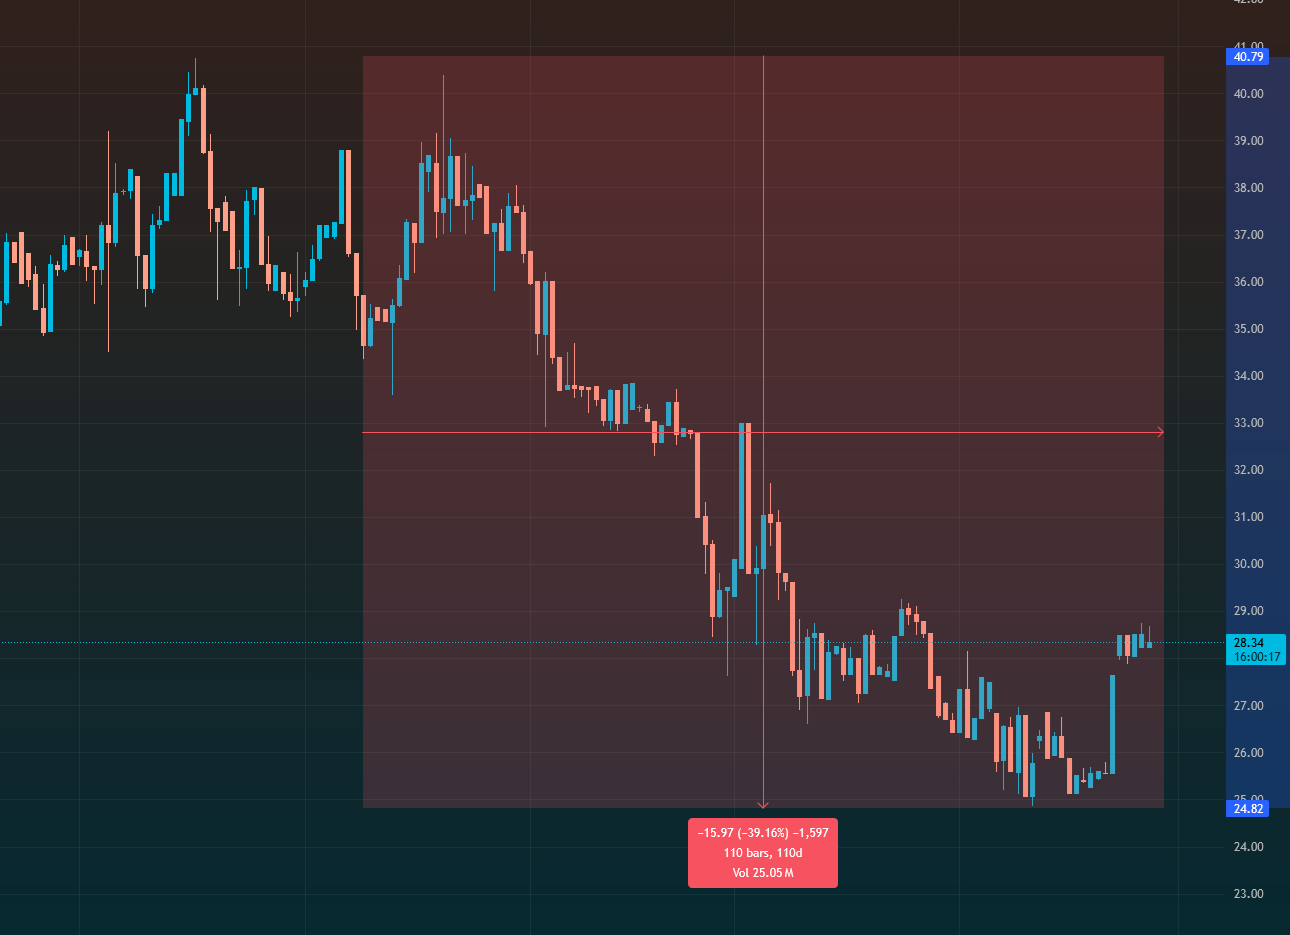
Bitcoin priced in gold is in deep correction
Of course, this is mostly due to the recent parabola in gold prices 🌟.
Gold is the classic anti-crisis, anti-inflation asset, so maybe — just maybe — we really have seen massive money supply expansion? Global M2 sure suggests so!😅
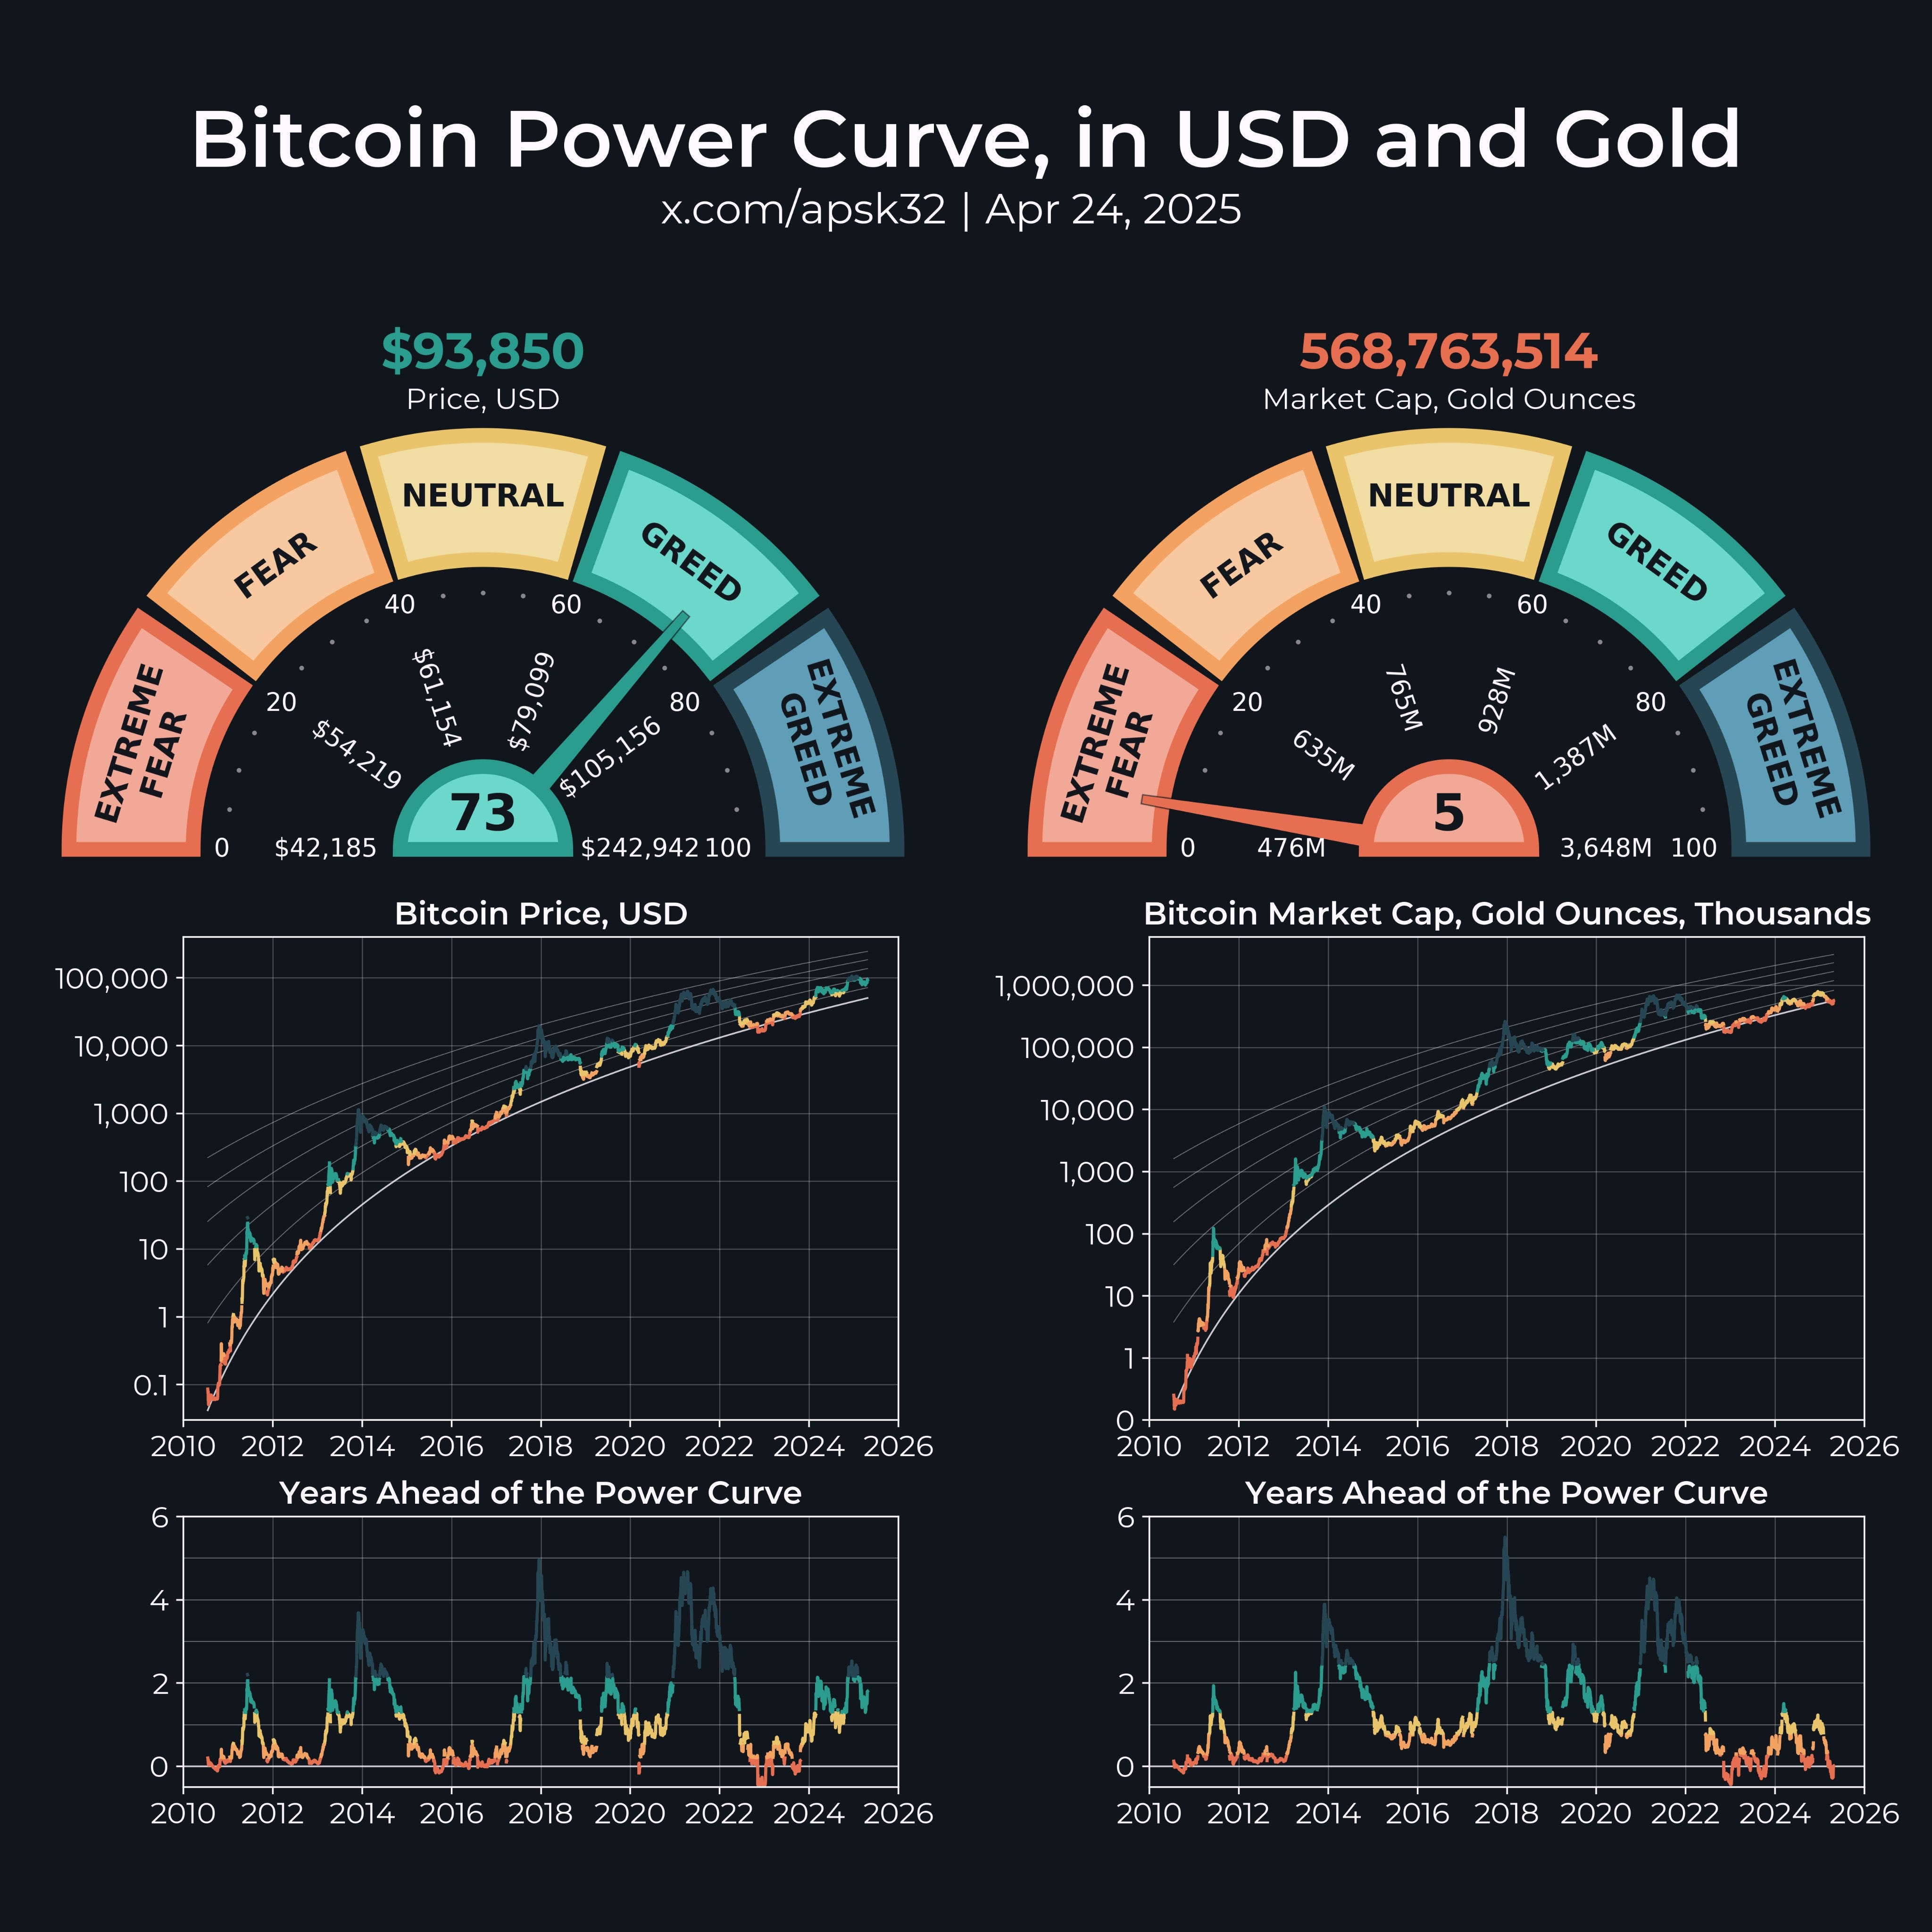
Measured in dollars, Bitcoin’s correction was only about 31%, which is not deep considering the macro chaos.
But measured in gold, Bitcoin's correction is -40%!
This is critical for understanding where we are in the current bull cycle.
Dollar valuations might be inflated due to currency devaluation and money printing, which also affects global M2 readings.
It seems likely that cyclicality will once again prove correct, and the timing of this bull run could really climax around the famous October-November timeframe 🎯.
Also, Bitcoin’s valuation in gold still leaves plenty of headroom for another big upward wave.
A very exciting hypothesis we’ll continue to monitor — and you definitely don't want to miss it! 🚀
Wall Street is playing the game
Last week was surprisingly positive for ETF inflows.

Accumulation of Bitcoin by institutional investors continued in
Keep reading with a 7-day free trial
Subscribe to CryptoFolks Newsletter to keep reading this post and get 7 days of free access to the full post archives.